Neutronics / Public benchmark / Two assisted experiments
Reproduce the result.
Check the confidence.
We tested an AI-assisted workflow against a published nuclear simulation reference. Then we checked whether one uncertainty estimate was too optimistic.
The setup
A public problem with a published reference.
C5G7 is a standard test problem for nuclear simulation. Its geometry and reference answers are public. We used OpenMC, an established simulation program, to reproduce those answers. The official example and reference were available throughout: this was an assisted reproduction, not a blind test of the AI.
The inputs, source data, solver output and numerical comparisons were retained. A separate agent examined the raw results, followed by an independent reconstruction of the complete pin-power comparison.
Experiment 1 / Reproduce
Check the global answer and every local comparison.
Problem
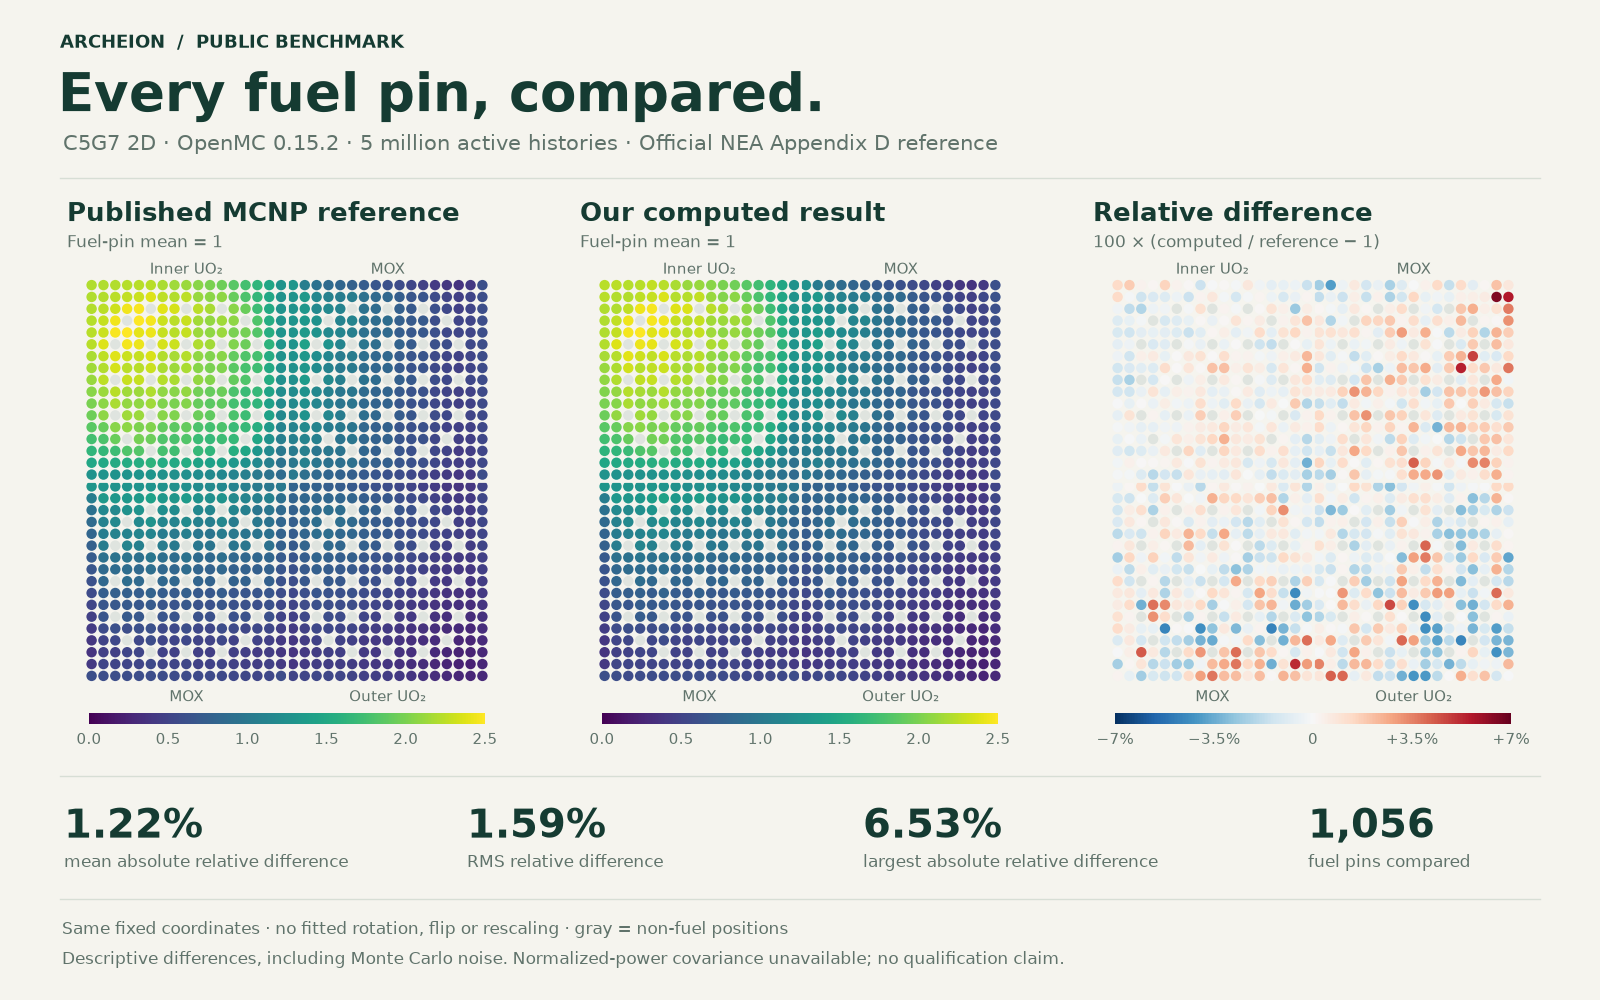
A close global answer can hide a different local power distribution. We therefore compared both the benchmark-wide neutron balance and all 1,056 fuel-pin powers.
What we found
After five million simulated neutron histories, the overall neutron-balance result was 0.042% away from the published reference. This overall result is called keff: we obtained 1.1860498, compared with 1.186550.
Across every fuel pin, the mean absolute relative difference is 1.22% and the maximum local relative difference is 6.53%.
Why it matters
The result can be inspected at the scale where a mismatch would appear. The global value and the full local map tell a stronger story together than either one alone.
Experiment 2 / Check confidence
Account for local powers moving together.
Problem
Individual power estimates can rise and fall together. If we assume they vary independently, we can underestimate the uncertainty when we add them together.
What we found
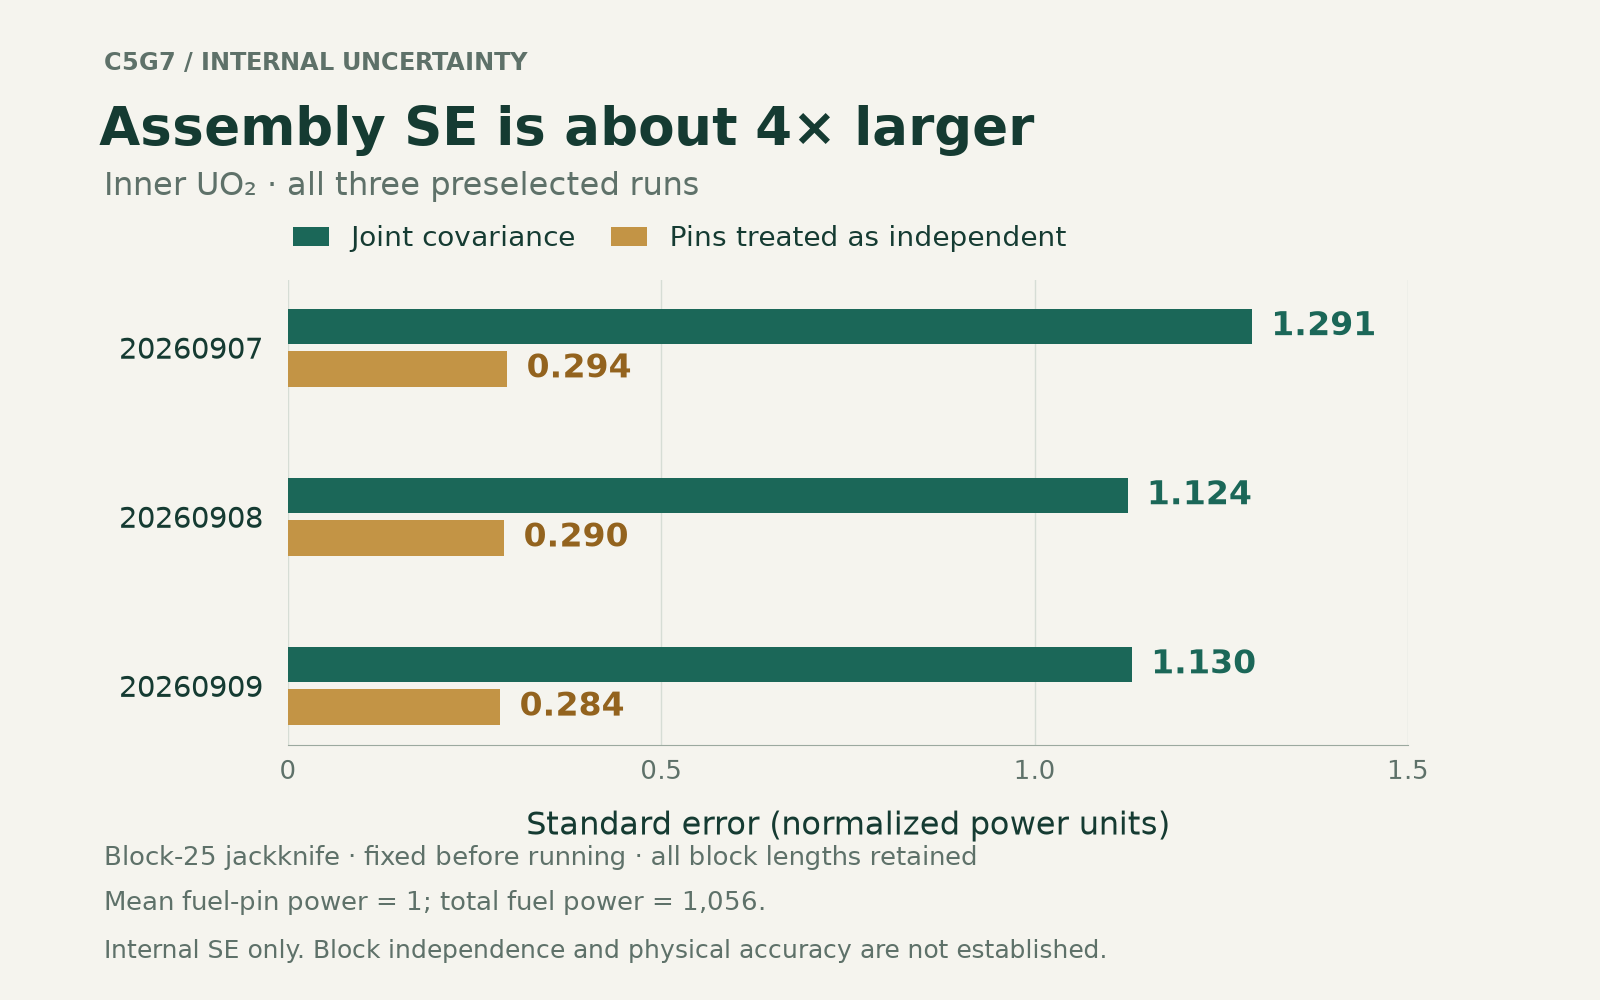
For one group of fuel rods—the inner UO₂ assembly—accounting for these shared fluctuations gave an estimated uncertainty roughly four times larger than treating each rod independently.
This compares the statistical uncertainty of the group’s total power, expressed as a standard error. The power values did not change.
Why it matters
A calculation can look convincing while its uncertainty is too optimistic. Keeping track of results that move together helps us describe how much confidence the simulation actually supports.
Technical detail, checks, sources and limits
Benchmark and global result
OpenMC 0.15.2, public C5G7 2D multigroup example. The reported run uses 600 batches of 10,000 histories, with 100 inactive batches and 5,000,000 active histories. The refined run reports keff = 1.18605 ± 0.00034; the full stored values are 1.1860498 with an OpenMC-reported standard error of 0.0003441, versus the published MCNP reference 1.186550. The ± value is one standard error reported by OpenMC, not a bound covering all physical modelling errors. The 0.042% relative comparison is an arithmetic result, not a regulatory acceptance criterion.
Local comparison
The 34 × 34 grid contains 1,056 fuel positions and 100 non-fuel positions. Fuel-pin powers are normalised to a mean of one, then compared at the same row and column. The mean absolute relative difference is 1.2213%, the root mean square relative difference is 1.5903%, and the maximum is 6.5333%. The largest difference is at row 2, column 33 in the declared top-to-bottom coordinate system.
All differences include Monte Carlo noise. The maps retain the official reference coordinate arrangement and symmetry. No rotation, fitted transform or additional symmetry averaging was selected to improve the result.
Recorded checks
- The multigroup input data were compared with the public source.
- Raw solver files were checked against the extracted results.
- The official electronic reference was located and its cells mapped explicitly.
- A separate calculation reconstructed all 1,056 local comparisons and the reported metrics.
- The replay package was checked for completeness and source identity.
The final pin-power audit records 61 independent checks and uses a separate comparison program. Some underlying libraries and the reference-workbook conversion remain common dependencies.
Uncertainty experiment
Three fixed-benchmark runs used distinct seeds and retained every active batch. A separate audit reconstructed all 1,500 saved batches. The primary block size of 25 was fixed before those runs, with seven block sizes retained for sensitivity analysis. Joint-covariance standard-error estimates for the inner UO₂ sum are 1.291, 1.124 and 1.130 normalised-power units; independence estimates are 0.294, 0.290 and 0.284.
The factor of roughly four compares standard errors, not variances. The original normalised-power covariance cannot be recovered retrospectively from its final statepoint alone. The three additional runs estimate covariance from newly retained batch vectors; they do not replace that missing information for the original run. The block analysis does not demonstrate independence of blocks or global convergence.
Scope and limitations
This is an academic neutronics reproduction. It does not establish thermohydraulic behaviour, measured reactor behaviour, physical validation, regulatory qualification or a general performance claim about AI systems. The benchmark example and reference were available during the work. The first reported power result remains unchanged by the later uncertainty experiment.
Public sources
NEA benchmark specification · Official NEA electronic appendices · OpenMC 0.15.2 source.
The reference is the published MCNP solution. Reference and computed arrays remain traceable in the retained replay package.